Notes on potential new sensors for Sonic Kayaks - turbidity and air quality
Posted Sept. 12, 2019 by Amber GriffithsAs part of our Sonic Kayak project, we have been looking at adding new sensors to the system. These are our notes from our research and prototyping.
Turbidity sensors
Since we started the Sonic Kayak project, a few people have asked us whether we could add a turbidity sensor – they were interested in using it to monitor algal blooms in an EcoPort, monitor cyanobacteria for a water company, and taking water quality readings for seaweed farming.
Turbidity sensors give a measurement of the amount of suspended solids in water – the more suspended solids, the higher the turbidity level (cloudiness) of the water. The most basic approach to working out water turbidity is to use something called a Secchi disk. These are plain white or black and white circular disks that are lowered slowly into the water, and the depth at which the disk is no longer visible is a rough measure of the cloudiness of the water. This is a great low-key approach, but the result is greatly affected by other factors such as the amount of daylight. More accurate equipment tends to use a light source and a light receptor, with the water placed in between – the amount of light that reaches the receptor from the light source gives a reading of how turbid the water is.
There are several pre-existing publications on how to make open source turbidity sensors (e.g. this and this). For the Sonic Kayaks, we sonify sensor data in realtime, and record the data every second for environmental mapping. This means we need to make a sensor that logs realtime continuous data and can be integrated into the existing Sonic Kayak kit, as opposed to a system where you take a one-off sample of water and run it through a separate piece of equipment in a laboratory.
We based our initial prototyping on the writeup found here. The basic electronics were tested on an Arduino Genuino Uno, with the modification in the code from pin ‘D1’ → ‘1’ (as D1 is not recognised as a pin number), and the addition of a 560Ω resistor for the white LED.
We cut the ends off a 50ml Falcon tube as this was the only tube-shaped thing we had available, drilled small holes for the LED and LDR, and sprayed the tube matt black on the inside and outside to reduce reflectivity from the shiny plastic tube. The LED and LDR were fixed in place using hot glue, wires soldered directly to the components, and the whole thing coated in bioresin for waterproofing (Fig 1).
For testing, we submerged the sensor in water for 20 minutes to check the waterproofing. We then took a sample of tap water, added a small amount of black acrylic paint, and did a series of arbitrary dilutions. LDRs decrease resistance with light intensity – so when more light hits the sensor, the less resistance there is, and the higher the voltage reading is, resulting in a higher numerical output. The numerical output is related to the voltage coming in, with an analogue to digital conversion (10 bit) applied such that 0V=0 and 5V=1023. If required, it is possible to do a lookup from the specific LDR sensor curve data to work out the voltage from the numerical output. The turbidity sensor v1 prototype returned reasonably consistent numerical values that related well to the types of results we might expect (any turbidity sensor would need to be calibrated with known samples before use).
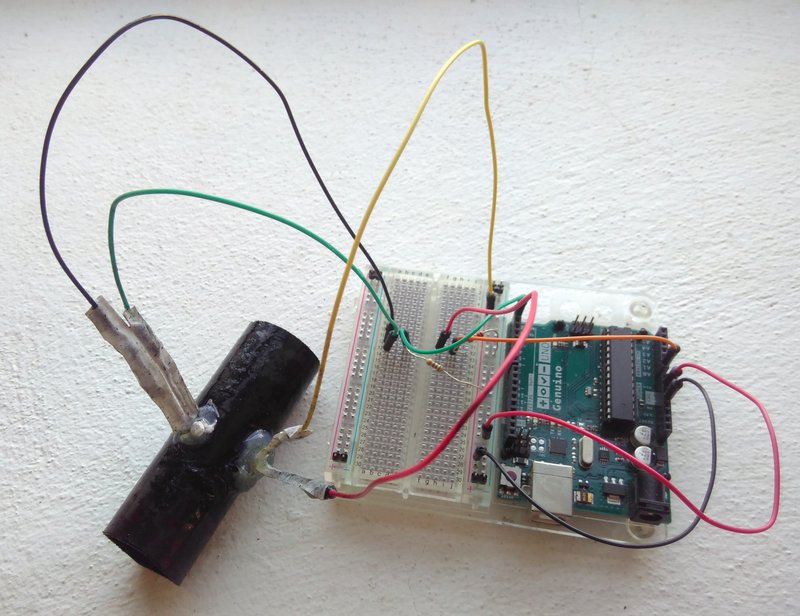
Fig 1. Prototype v1 – Test build and wiring.
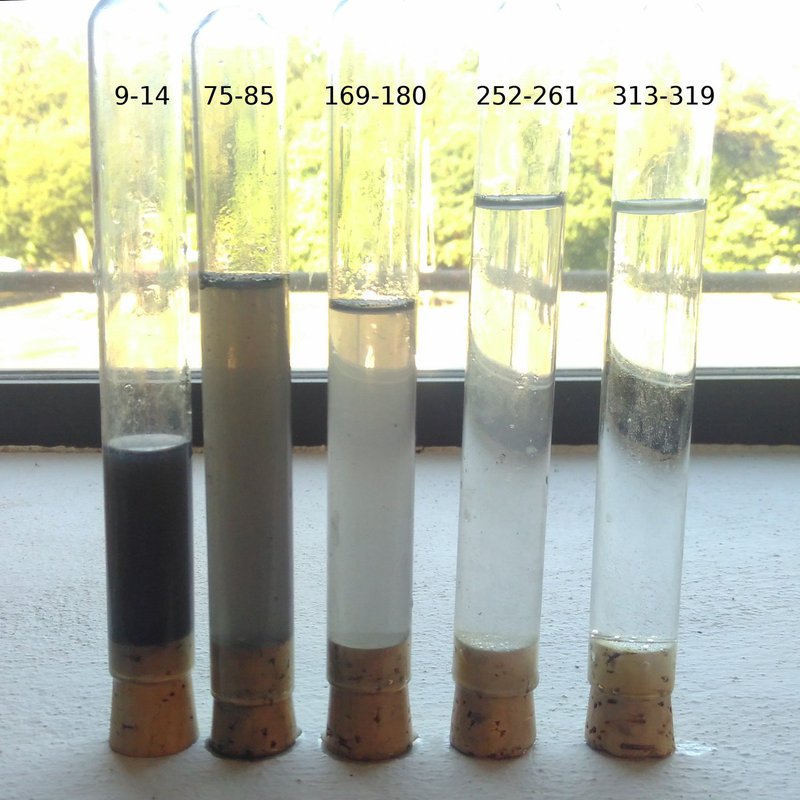
Fig 2. Test dilutions for prototype v1, with numerical output ranges.
Moving on from the proof of principle prototype v1, we made a larger turbidity sensor for prototype v2 using 40mm black plumbing pipe with longer wiring that could reach from under the kayak to the main electronics box on top of the kayak, with a single multicore cable (old network cable) that split to meet the LDR and LED. Once the components were soldered to the wiring, we used liquid electrical tape to waterproof the components and bare wire before glue-gunning the components into the tube. The cable join was then bonded to the pipe using self-amalgamating waterproof tape, just to make this weak point more robust. For this version, a mesh made from a small square of Stay Put was attached to each end of the main tube using cable ties and thin rope, to act as a filter to stop things like seaweed entering the tube. Small fishing weights were also attached to each end of tube to pull the sensor down underwater.
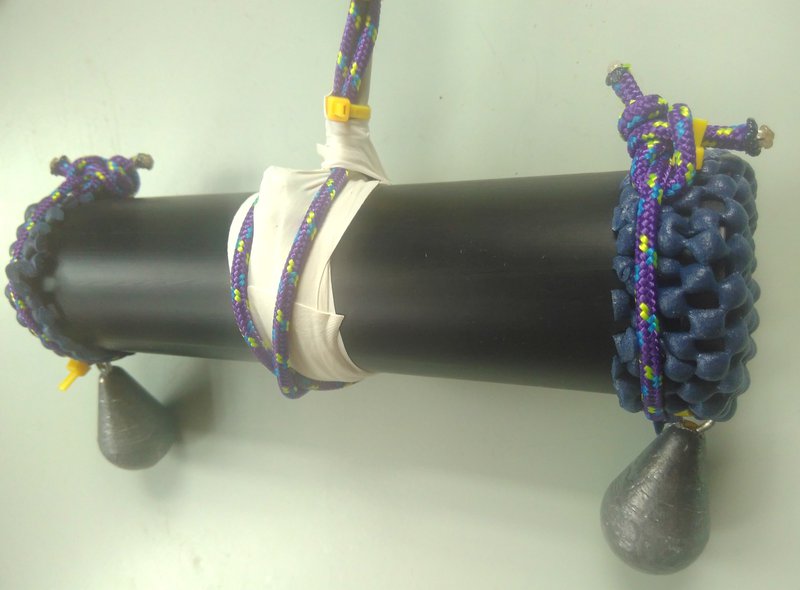
Fig 3. Prototype v2.
Version 2 of the turbidity sensor was integrated into the Sonic Kayak system for preliminary testing. It survived a 20 minute trip out on a lake, which is a good proof of concept for the electronics waterproofing (which is in some ways the hardest bit of the Sonic Kayak project). When paddling the sensor stayed at a reasonably constant depth, but travels sideways – ideally it would travel in line with the kayak, with the tube entrance/exit facing the front/back of the boat. Some options for improving this include fixing it to the kayak in some way, or designing fins attached to the tube (e.g. by 3D printing the housing as a single piece). The sensor was tested at the same time as two temperature sensors and a hydrophone, and we definitely need to work on making the sonifications from each sensor more distinct, as it became a cacaphony of confusing noise rather than an informative and beautiful sonic experience. The use of mesh over each end served its purpose, but a more robust solution might again be to include this as part of a 3D printed housing, or perhaps find a local bar with a stash of politically-unusable plastic straws, chop these up into small lengths, and fill the ends of the tube with them. As it stands, we have proof-of principle that this DIY sensor approach is viable, but will need to do some more work on correcting the flow direction and sonification integration before we will be happy with it.
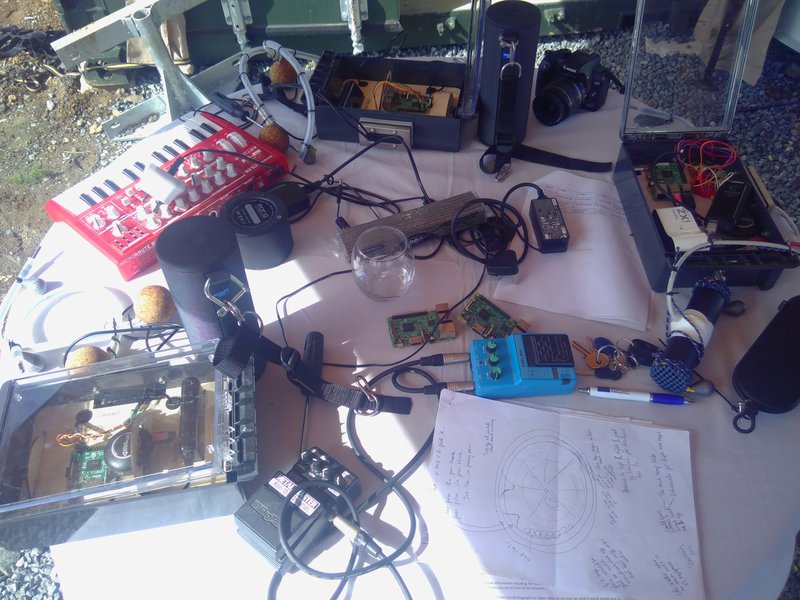
Fig 4. Turbidity sensor prototype and the Sonic Kayak system - there are 3 kits in this photo, it's the one on the right!
Air quality sensors
This time we are following a hunch rather than pursuing an externally requested direction. Our studio is based on the edge of Falmouth harbour. This is a working harbour, used by small commercial fishing businesses, a large shipyard, houseboats, and recreational water users including yacht enthusiasts, kayakers and swimmers. Many of these users dump waste, sewage and fuel straight into the water - we routinely see slicks of fuel on the water surface and see/smell clouds of pollution in the air, and then see children jumping in the water for a swim or kayakers paddling through.
To the best of our knowledge, nobody has mapped air pollution over water, yet we believe it is likely that the local industry and other users are causing air pollution low lying over the water that could be highly damaging to the health of people and other animals that spend time on the water surface (like birds and seals). So we have started looking at integrating air quality sensors onto the Sonic Kayaks. This process begins with needing to understand the various pollutants. [apologies for the lack of subscript for the molecular formulas, it's a limitation of our web design]
Defra (the UK Government Department for Environment, Food & Rural Affairs) says this:
"Shipping is a growing sector but one of the least regulated sources of emissions of atmospheric pollutants. Shipping makes significant contributions to emissions of nitrogen oxide (NOx) and sulphur dioxide (SO2) gases, to primary PM2.5 and PM10 (particulate matter, PM with diameter less than 2.5 micrometres and 10 micrometres respectively), which includes emissions of black carbon, and to carbon dioxide. Chemical reactions in the atmosphere involving NOx and SO2, and ammonia (NH3) gas emitted from land sources (principally associated with agriculture), lead to the formation of components of secondary inorganic particulate matter. These primary and secondary pollutants derived from shipping emissions contribute to adverse human health effects in the UK and elsewhere (including cardiovascular and respiratory illness and premature death), as well as environmental damage through acidification and eutrophication."
For a little more information on the NOx and SO2 interactions they also say this:
"PM2.5 can also be formed from the chemical reactions of gases such as sulphur dioxide (SO2) and nitrogen oxides (NOx: nitric oxide, NO plus nitrogen dioxide, NO2)"
This is a totally new area for me, so my first thoughts were to go through these different pollutants and dig into what their health impacts are. The most clear information seems to be about particulate matter pollution, for example I found this from the NHS about particulate matter, saying that ‘safe levels’ are not actually safe:
"As a general rule, the lower the PM, the more dangerous the pollutant is, as very small particles are more likely to bypass the body’s defences and potentially cause lung and heart problems."
I’ve also gathered together some exposure guidelines from the World Health Organisation, the Environmental Protection Agency, and other reasonably reputable sources – the units of measurement are often different, and the limits differ depending on where you look, but it’s a start and I now feel reasonably confident that these are the pollutants that matter in our context:
Pollutant NOx
Exposure guidelines WHO NO2: 40 μg/m3 annual mean, 200 μg/m3 1-hour mean
Health impacts Causes inflammation of the airways at high levels. Can decrease lung function, increase the risk of respiratory conditions and increase the response to allergens. Defra estimates that the UK death rate is 4% higher due to nitrogen dioxide pollution – around 23,500 extra deaths per year.
References
https://www.who.int/news-room/fact-sheets/detail/ambient-(outdoor)-air-quality-and-health
https://www.epa.gov/no2-pollution/basic-information-about-no2
https://www.theguardian.com/environment/2015/oct/04/nitrogen-oxides-cost-health-impacts-diesel
Pollutant SO2
Exposure guidelines AEGL-1 (nondisabling – may be problematic for asthmatics) 0.20ppm, AEGL-2 (disabling) 0.75ppm, AEGL-3 (lethal) 30ppm for 10 mins – 9.6ppm for 8h. WHO: 20 μg/m3 24-hour mean, 500 μg/m3 10-minute mean
Health impacts Sulfur dioxide irritates the skin and mucous membranes of the eyes, nose, throat, and lungs. High concentrations can cause inflammation and irritation of the respiratory system. The resulting symptoms can include pain when taking a deep breath, coughing, throat irritation, and breathing difficulties. High concentrations can affect lung function, worsen asthma attacks, and worsen existing heart disease in sensitive groups.
References
https://www.ncbi.nlm.nih.gov/books/NBK219999/
https://www.who.int/news-room/fact-sheets/detail/ambient-(outdoor)-air-quality-and-health
https://www.nps.gov/subjects/air/humanhealth-sulfur.htm
Pollutant CO
Exposure guidelines AEGL-1 (nondisabling) – not recommended because susceptible persons may experience more serious effects at concentrations that do not affect general population. AEGL-2 (disabling) 420ppm for 10 mins – 27ppm for 8h. AEGL-1 (lethal) 1800ppm for 10 mins – 130 ppm for 8h
Health impacts Carbon monoxide enters your bloodstream and mixes with haemoglobin to form carboxyhaemoglobin. When this happens, the blood is no longer able to carry oxygen, and this lack of oxygen causes the body's cells and tissue to fail and die. A tension-type headache is the most common symptom of mild carbon monoxide poisoning. Other symptoms include: dizziness, feeling and being sick, tiredness and confusion, stomach pain, shortness of breath and difficulty breathing. Long-term exposure to low levels of carbon monoxide can lead to neurological symptoms like difficulty thinking or concentrating, and frequent emotional changes.
References
https://www.ncbi.nlm.nih.gov/books/NBK220007/
https://www.nhs.uk/conditions/Carbon-monoxide-poisoning/
Pollutant NH3
Exposure guidelines AEGL-1 (nondisabling) 30ppm, AEGL-2 (disabling) 220ppm for 10 mins, 110 ppm for 8h., AEGL-3 (lethal) 2700ppm for 10 mins, 390ppm for 8h.
Health impacts Irritation to eyes, nose, throat; dyspnea (breathing difficulty), wheezing, chest pain; pulmonary edema; pink frothy sputum; skin burns, vesiculation.
References
https://www.epa.gov/aegl/ammonia-results-aegl-program
https://www.cdc.gov/niosh/npg/npgd0028.html
Pollutant Primary PM2.5
Exposure guidelines ‘there is understood to be no safe threshold below which no adverse effects would be anticipated’. 7% increase in mortality with each 5 micrograms per cubic metre increase in particulate matter with a diameter of 2.5 micrometres (PM2.5). European annual mean limit of 25μg/m3. World Health Organisation: 10 μg/m3 annual mean, 25 μg/m3 24-hour mean
Health impacts Particles in the PM2.5 size range are able to travel deeply into the respiratory tract, reaching the lungs. Exposure to fine particles can cause short-term health effects such as eye, nose, throat and lung irritation, coughing, sneezing, runny nose and shortness of breath. Exposure to fine particles can also affect lung function and worsen medical conditions such as asthma and heart disease. Scientific studies have linked increases in daily PM2.5 exposure with increased respiratory and cardiovascular hospital admissions, emergency department visits and deaths. Studies also suggest that long term exposure to fine particulate matter may be associated with increased rates of chronic bronchitis, reduced lung function and increased mortality from lung cancer and heart disease. People with breathing and heart problems, children and the elderly may be particularly sensitive to PM2.5.
References
https://laqm.defra.gov.uk/public-health/pm25.html
https://www.nhs.uk/news/lifestyle-and-exercise/safe-levels-of-air-pollution-could-still-be-harmful/
https://www.who.int/news-room/fact-sheets/detail/ambient-(outdoor)-air-quality-and-health
https://www.health.ny.gov/environmental/indoors/air/pmq_a.htm
Pollutant Course particulate matter: Primary PM10
Exposure guidelines World Health Organisation: 20 μg/m3 annual mean, 50 μg/m3 24-hour mean.
Health impacts As for PM2.5, but these coarser particles are of less risk than PM2.5.
References
https://www.who.int/news-room/fact-sheets/detail/ambient-(outdoor)-air-quality-and-health
The next step is to look at sensors. Via the wonders of Twitter, we were recommended alphasense for pre-made gas sensors. Apparently this technology is hard to calibrate, and cheaper sensors tend to drift in their calibration, so we might end up only being able to look at relative values if we were to produce a map of air quality over water. This might be OK, but it would be nicer to be able to compare against the ‘safe’ exposure limits. One option might be to calibrate against a more professional/pricey sensor setup at a fixed location before and after doing the mapping.
Since the world of gas sensing is mainly done using nanotechnology, it’s probably currently a bit out of the scope for in-house DIY approaches. As a compromise, we thought it was worth trying an Enviro+, which is a premade add on for a Raspberry Pi which measures air quality (pollutant gases), temperature, pressure, humidity, light, and noise level.
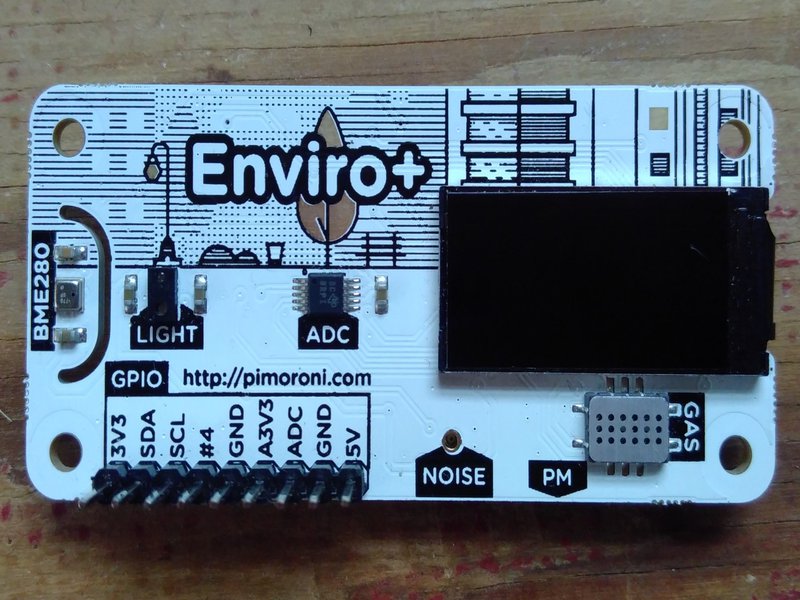
Fig 5. The Enviro+ that we tried and blew up
We had a go at integrating an Enviro+ into the Sonic Kayak system (no easy job given the number of different sensors we’re now trying to run), and got it working alongside the prototype turbidity sensor. The analogue to digital converter on the Enviro+ is higher resolution than we had already had on the Arduino or ATmega328 chip that we use, which is great because it means the data is more sensitive. The LCD screen was a nice touch and could prove useful for debugging. There’s an obvious problem with the design limitations though, as all our kit is sealed inside a waterproof box, with cable glands to pass wiring through the box – an air quality sensor needs to be exposed to the air, so we’d need to think about the design practicalities including waterproofing. Sadly we blew up our Enviro+ by later trying to power it from the 5V and ground pins rather than plugging it into the GPIO, as we need that free for our GPS and other sensors. Probably we just blew up the voltage regulator and could re-use the sensor components themselves. Since it seemed technically viable, we looked a bit more into what the Enviro+ is actually measuring, the makers say:
“The analog gas sensor can be used to make qualitative measurements of changes in gas concentrations, so you can tell broadly if the three groups of gases are increasing or decreasing in abundance. Without laboratory conditions or calibration, you won't be able to say "the concentration of carbon monoxide is n parts per million", for example.Temperature, air pressure and humidity can all affect particulate levels (and the gas sensor readings) too, so the BME280 sensor on Enviro+is really important to understanding the other data that Enviro+ outputs.”
Looking into these ‘three groups of gases’, it turns out that they basically have 3 sensors which detect carbon monoxide (CO, reducing), nitrogen dioxide (NO2, oxidising) and ammonia (NH3). But – these sensors are also sensitive to other very common gases (like hydrogen!) - which means that the output from a sensor doesn’t necessarily reflect the amount of the gas you are interested in, it might reflect a mix of gases. Again calibration is an issue, so we’d only ever be likely to be looking at relative values, and also we wouldn’t be sure what gasses we were actually detecting. It seems like low-cost research-grade gas sensing is still a little way off. The exception seems to be NH3, which might not be worthwhile detecting in its own right, as it only really seems to be an issue because it is a precursor for particulate matter:
“As a secondary particulate precursor, NH3 also contributes to the formation of particulate aerosols in the atmosphere. Particulate matter is an important air pollutant due to its adverse impact on human health and NH3 is therefore also indirectly linked to effects on human health”
In the interests of getting something up and running quickly, that fits with our open hardware ethos, we may be better off starting by just looking at particulate matter. Our brilliant friend and data visualiser, Miska Knapek pointed us towards Luftdaten, which he is currently working on. They have designed and published plans for a fine particulate matter (PM2.5) sensor that is open source and arduino based. The challenge with this is going to be waterproofing it for use on the boats, as unlike rain, water when kayaking can come from all directions, including all at once if you capsize. There are also pre-made cheap (£25) particulate sensors, for example this one which is small enough to use on a kayak at ~5cm and is designed to work with the Enviro+ and Raspberry Pi. These have fans to suck air through them and a laser to detect the number and size of particles in the air, and they work for various sizes of particulate matter (PM1.0, PM2.5 and PM10).
This is all a very new area for us (and it’s a big area!), so if we’ve made any mistakes or missed anything obvious we’d love to hear your ideas. It seems very feasible to add turbidity and particulate matter sensors, so if you’re interested in using these then it would also be helpful to get in touch, as we’ll need examples of practical uses if we’re to look for some funding to support adding these.
This R&D work has been funded by Smartline (European Regional Development Fund).
Created: 15 Jul 2021 / Updated: 15 Jul 2021